The index
The index is the one thing the whole product rests on. It has to be impossible to game with a deposit, hard to move with a single candle, and checkable by anyone. This page is the specification.
Definition
pricei = pricei−1 × ( 1 + ri ), price = 100 at listing
7d% = pricenow ÷ pricenow − 7d − 1
- Sampled once a second per trader on the built-in feed, every 30 seconds on a polled network feed.
- The price is a chain of every sample since the market listed. It is never re-based: a restart, a change of data feed or a change of formula continues from the last price published, and the market started over at 100 only once, on 20 September 2026.
- The PnL that feeds the chain is the median of the last 5 raw samples, so one bad read never enters the price.
- The level is never taken from a saved price. The oracle saves ln(price ÷ 100) at the first point it keeps, and a restart re-derives every price from that and the saved PnL series, so a process that read a book badly in its last seconds cannot move a market.
- The denominator is the largest capital at risk over the last ten minutes of samples, floored at $1,000: a book a price source has not finished pricing, or one just sold down, reads small for a while, and a PnL change measured against that would print a move that never happened. One sample's return is clamped to −90% and +900%.
Deployed capital, not balance
Account balance is the obvious denominator and the wrong one. A trader who deposits $1M of idle stables halves his percent return without changing a single trade; a withdrawal doubles it. Fomoliquid divides by the market value of open positions: the capital the trader actually has at risk. Idle stables never count. A deposit that sits idle changes nothing. Capital enters the denominator when it is put into a position, grows and shrinks with that position, and leaves when the position is closed. Value rather than cost matters for the traders this venue lists: one sitting on a position bought for $70k and now worth $6M has $6M at risk, and a 10% day on that book is a 10% move, not a 900% one.
Because deployment moves over time, each step's gain or loss is measured against the capital that earned it and the steps are chained, the way a fund reports a time-weighted return. A trader who ran $50k for six days and $500k for the last day is measured against the capital he actually carried on each day, and a book that loses 80% of its value reads −80%, not the −400% a single difference over what is left would print.
Positions are marked at the quote. An optional rule (MARK_TO_LIQUIDITY=1, off by default) marks each one at what it could sell for instead: the quote less what selling the whole of it into its deepest pool at once would move the price: the pool keeps a constant product, so a sale worth V into a pool holding L fetches V·L/(L+2V); the first hundredth of the pool sells at the quote, a sale that small moving it less than its spread, so a position a tenth the size of its pool is marked about a sixth under the quote and one the size of its pool at a third of it. A trader who buys a fifth of a pool is under water on exit from the moment of buying, and the index says so; a pool that drains marks the position down, and the timeline names the move. The market page shows every position's mark against its quote and the pool behind it. The rule is off by default because a position larger than its pool is worth about half the pool's liquidity figure under it whatever the token's price does, and a swing in that figure prints as a move of the position, which is how five markets fell on 30 September. Turning the rule off, or on, moves the baseline and never the price: the difference on what is already held is absorbed, and listed under what was absorbed.
What the book keeps. A quote is a number; the pool behind it is what a sale would get. For every position worth fifty dollars or more at its quote, the feed reads the dollars in the token's deepest pool (DexScreener for every chain it lists, the chain's own pools for the rest, read again every half hour). A position worth more than ten times that depth is left out of the book until it is back within reach of its pool, as a token without a price is: nothing sells a position for ten times its pool, and no quote proves a value no pool could pay. The index sees neither the position nor what it does meanwhile, and the trader page counts what is out and at what quote-value; a quote with no depth figure at all (a chain no source lists) stands as before. A sale out of a position the index had not priced realises against a cost the index never saw, so its result moves the baseline and not the price. A held move the book could not have made in the time, a loss past the whole of the capital at risk or a gain past three times it, goes flat however long it stands: the chain keeps its level, the step is out of it for good, and the timeline says so. A move held within the hour after a start waits for the hour, while the feed re-reads every wallet. The third series, from 29 October 2026, relisted every market at 100 under these rules; the levels before carried the steps the old rules let through.
The seven-day figure
The price itself has no window: it moves when the trader's PnL moves and at no other time, so a win from eight days ago never “rolls off” and moves the market while the trader does nothing. The seven-day return shown in the market header is the price now against the price seven days ago, for context. The market page shows the window start and the PnL at that point with every update.
The median filter
The PnL feeding the chain is a median of the last 5 samples: five seconds of samples on the built-in feed, a few minutes on a polled one. One bad read, or one deliberate rug candle in a trader's book, never enters the price at all; it takes a sustained move to settle anything. This is the third of the four manipulation defences, and the cheapest.
The price
Every market lists at 100. 112.40 means the trader has returned +12.40% on the capital at risk since listing, compounded sample by sample; 90.00 means −10%. The floor is 0.01. A long on the index is a long on the trader's return from here.
The index moves for a trade the trader made and for the price of what they hold, and for nothing else: a change in the book that neither explains (a partial balance read, tokens sent away, a token priced late) is absorbed into the baseline and named on the market page. Two further rules keep one read from moving a market on its own. Capital at risk is never taken as less than a twentieth of the account: a trader who is nearly all cash is not a hundred-times-levered bet on the crumbs, and a listed trader cannot swing their own market with a small gamble. And a read that moves the PnL by a fifth of capital at risk is held, whatever moved it: the index stands where it was while the samples that follow are watched, for ten minutes, or thirty when the move reached half of capital at risk. If the PnL comes back to where it was, the excursion was a glitch (a quote, a balance read that lost a position, a trade the feed valued wrongly) and none of it reaches the chain. If it stands, every held sample enters the chain together, so a real collapse prints late but whole. The market page says what is being verified while it is. Behind that, the feed questions a trade booked at a price more than three times from the token's market price: a sale into a collapse is confirmed within minutes, when the quote follows, and prints then; a transfer paired with cash that was not its proceeds never is, and its PnL stays out of the index.
A market can be relisted: it starts again at 100, every open position settled at the last mark first and resting orders cancelled, on both venues. That happens when the feed's accounting changes (a level built by one accounting says nothing under another) and when an operator relists a market whose level bad reads have made meaningless. What the market prices from a relisting on is the trader's return from there.
Warm-up
With fewer than seven days of samples, the seven-day figure runs from the first sample and the market is flagged warming. Everything trades normally; the flag disappears once the window is full. The price is unaffected.
Transparency
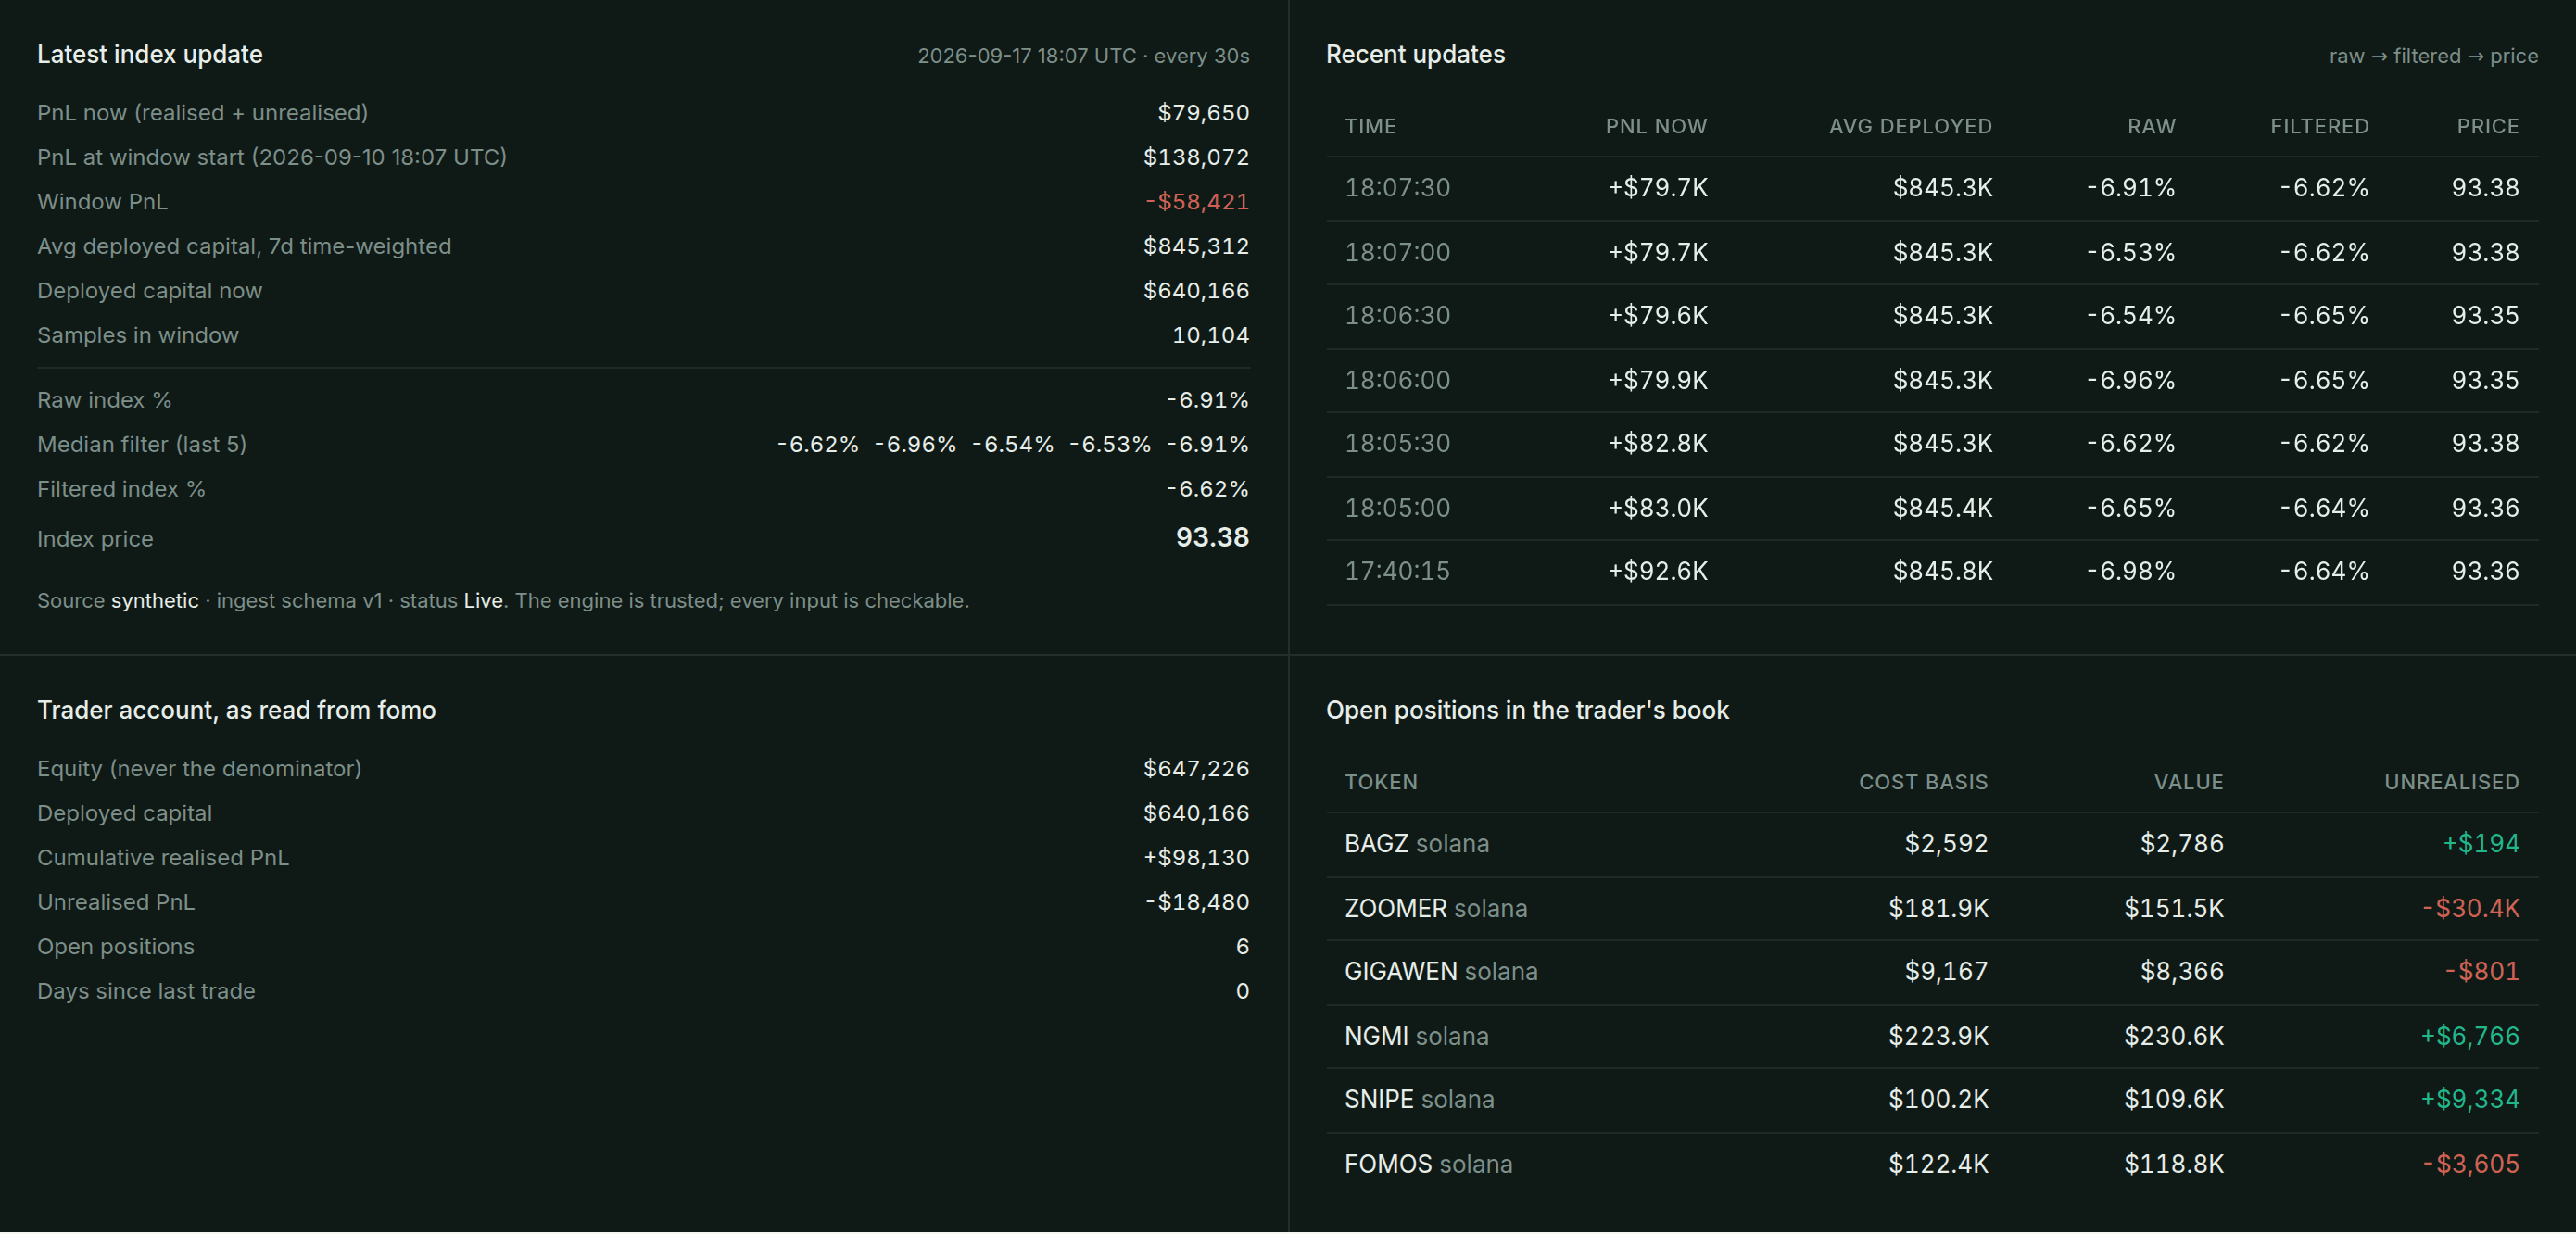
The engine is trusted; every input is checkable. That posture defuses most “the oracle is rigged” discourse before it starts, and it is how a market on a person stays credible with the person.
Under the chart, every market page keeps a timeline of what moved it over the last week, newest first, one line per cause. A trade the feed booked, at the time it landed on the chain, with the amount, the PnL a sale realised and how long after landing the feed saw it. A run of price moves on a held token, from the mark it began at to the mark it ended, with the price over the run, the units it applied to and what it did to the PnL; a run is one line while the token keeps moving, and is closed once its price has stood still for ten minutes or the run has lasted an hour, and it is named once it has moved the PnL by a hundred dollars or a hundredth of capital at risk. A change the feed absorbed rather than printed, with the reason. And the moves the engine held: when a read was held, and whether it was printed or dropped. Every candle has a line behind it.
Above the chart, the page says how the trader trades, over the last few hundred trades the feed keeps per wallet and since when: the win rate over the sales that realised a gain or a loss (a sale of units bought before the trades kept decides neither), how long the units sold were held against the oldest buys kept, trades a day, the average trade, what the last day and week realised, and the best and worst sale with what they returned on cost. The traders list carries the win rate and the pace.
Worked example
| Input | Value |
|---|---|
| PnL now (realised + unrealised) | $81,434 |
| PnL at window start, seven days ago | $173,945 |
| Window PnL | −$92,512 |
| Average capital at risk over the window | $849,550 |
| Seven-day return | −10.89% |
| Price seven days ago | 100.23 |
| Index price | 89.31 |
These are the numbers from the transparency panel above. The trader is down 10.73% on the capital he has carried this week, so his market trades near 89. Read the rest of the mechanism in Mark price and the vAMM.